Organizational Management and Future Planning
Empower Your Organization Today and Tomorrow
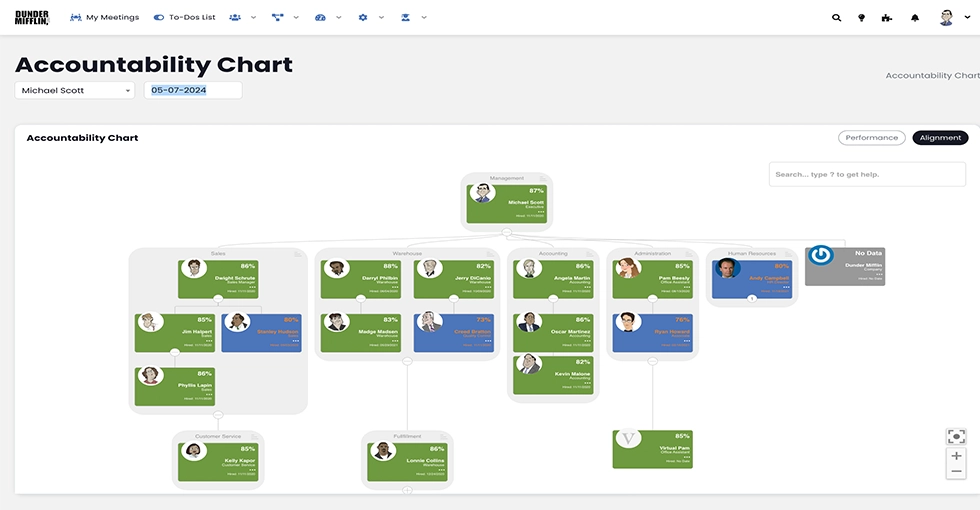
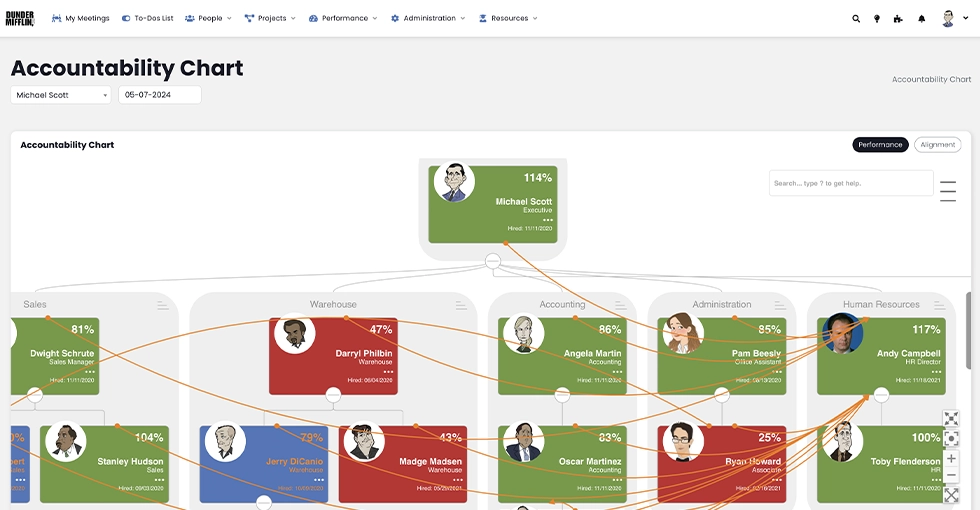
Navigate through our Interactive Accountability Chart to manage your current organizational structure efficiently and utilize our Future Accountability Chart to visualize and plan for future growth and changes.

Customization at Your Fingertips: Tailor Your Organizational Chart to Fit Your Needs
Every organization is unique, and so should be its structure. With Performance Scoring, you have the freedom to customize each aspect of your organizational chart, today and into the future. Whether it’s a small department, leadership hierarchy, or a complex enterprise structure, our platform adapts to your needs. Customize departmental alignments, manage reporting lines with ease, and create a structure that reflects your team’s culture and objectives. This tailored approach ensures that your organization’s framework is always aligned with its strategic goals.
Dynamic Structure Management
Adjust and reposition roles and responsibilities within your organization effortlessly, ensuring your structure aligns with current operational needs.
Plan Your Organization’s Future
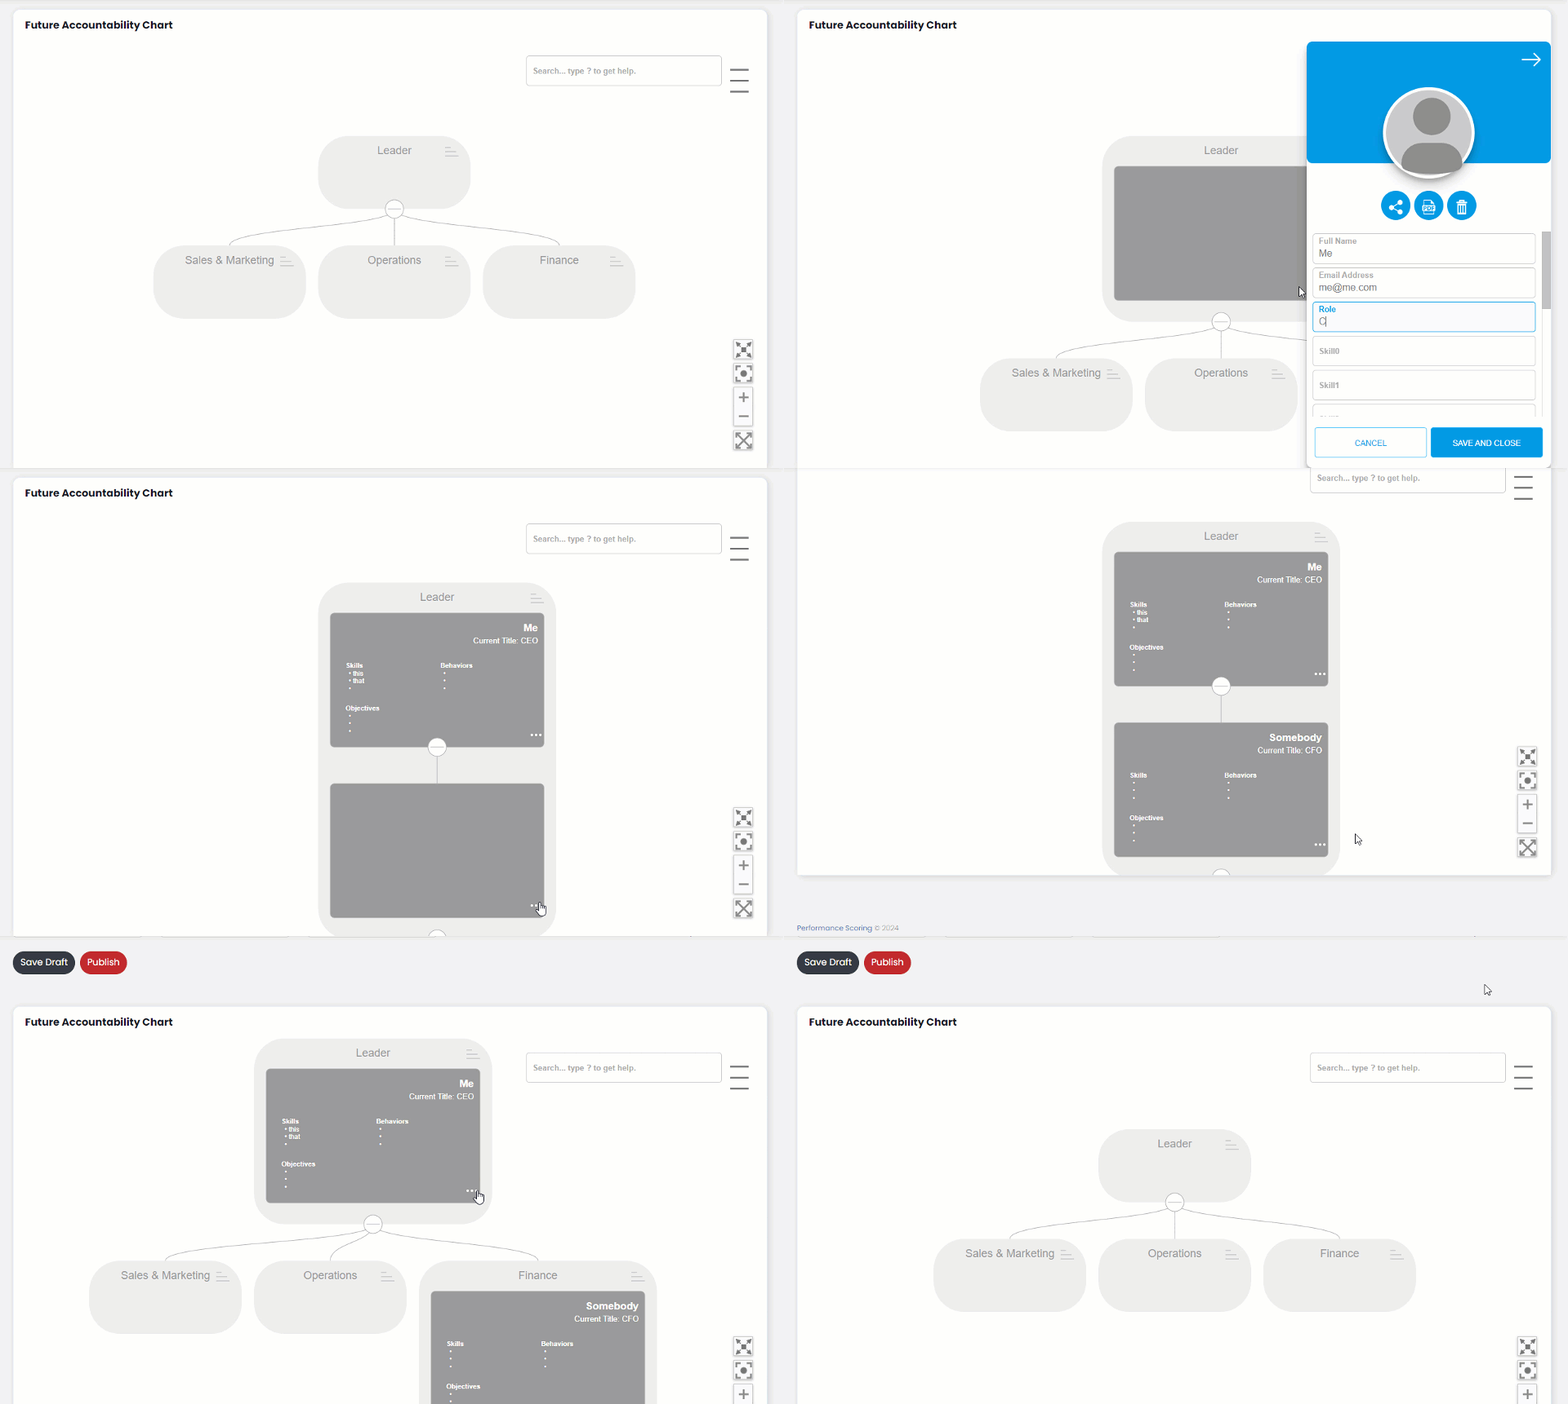
Forecast and design future organizational roles and structures with our Future Accountability Chart. This tool is ideal for succession planning, scenario analysis, and strategic alignment.
Plan for the Future
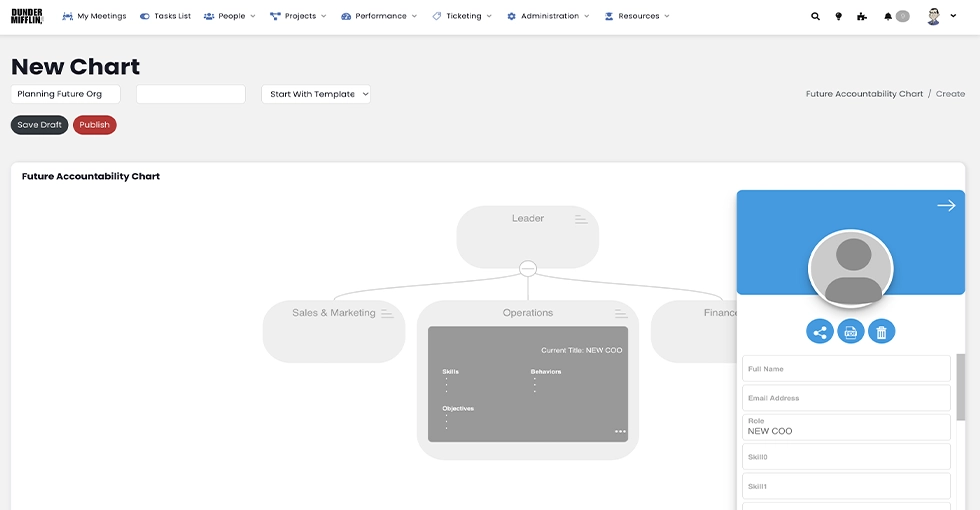
Create new charts with options to start from scratch, use existing templates, or modify current organizational structures to plan for future scenarios.
Define Future Roles
Customize future roles with required skills, behaviors, and objectives, facilitating detailed and targeted role planning. Identify skill gaps and coach your people towards filling them in a well-planned career path.
Activate and Assign Future Roles
Seamlessly transition future roles into active parts of your organization, with tools to assign these roles to suitable candidates, thereby updating organizational roles and responsibilities.
Empower Your Organization with Advanced Tools
Ready to enhance the management of your current structure and strategically plan for the future? Access our combined organizational management tools today.


