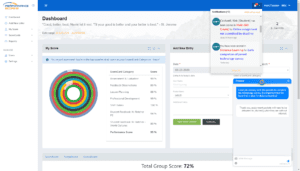
The My Score page displays your Performance Scores for each ScoreCard Category that you are scored in relative to your peers that are also scored in these categories. It also displays your overall Performance Score. To view the My Score page first login to your company’s Performance Scoring application. Once logged in the homepage will display My Score.
Here you will see your overall performance score and your performance score for each ScoreCard Category that you are scored in dating back 30 days. You can also view your scores on the responsive circle graph. As you scroll over the circle graph each color represents a different ScoreCard Category and your performance score will appear in the center of the graph.
Your Performance Score can be filtered by date range by selecting the dates in the date range at the top of the page. This allows you to view and compare your month–over–month or quarter-over-quarter development in each of the ScoreCard Categories that you are scored in. To view the entries that lead to the performance scores, use the FactorBoard. For additional support please contact your Account Manager or email support@performancescoring.com.


