Access the Accountability Chart
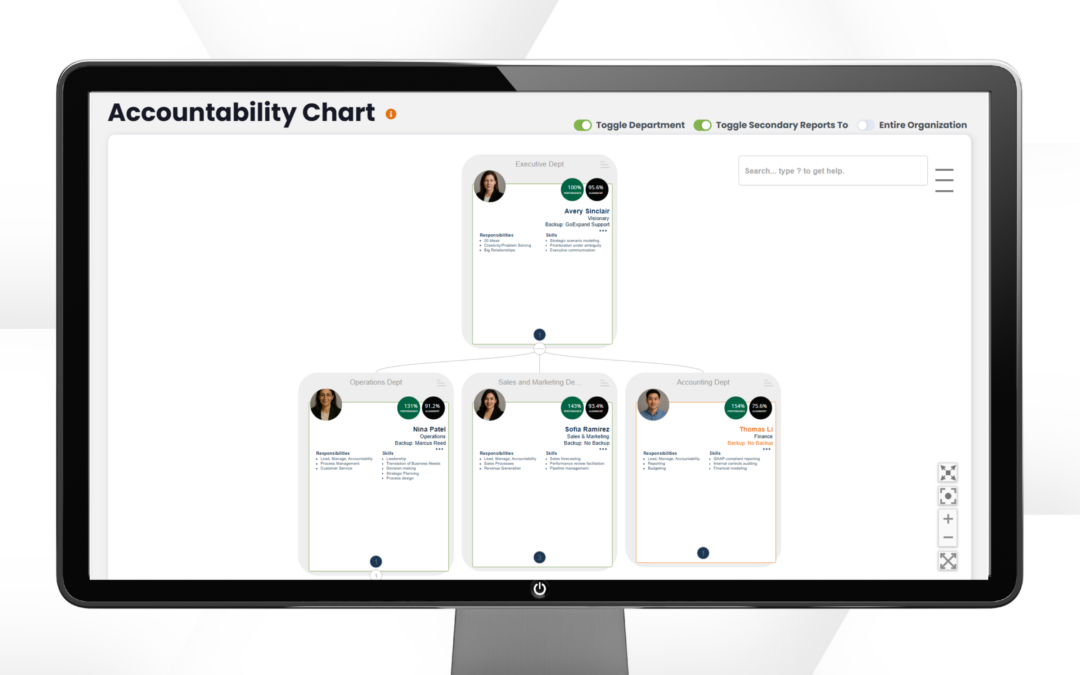
The Accountability Chart in Performance Scoring shows how work is owned and organized across the organization. It clearly defines roles, responsibilities, and reporting structure so everyone knows who is accountable for what. This helps reduce confusion, improve alignment, and support stronger execution.
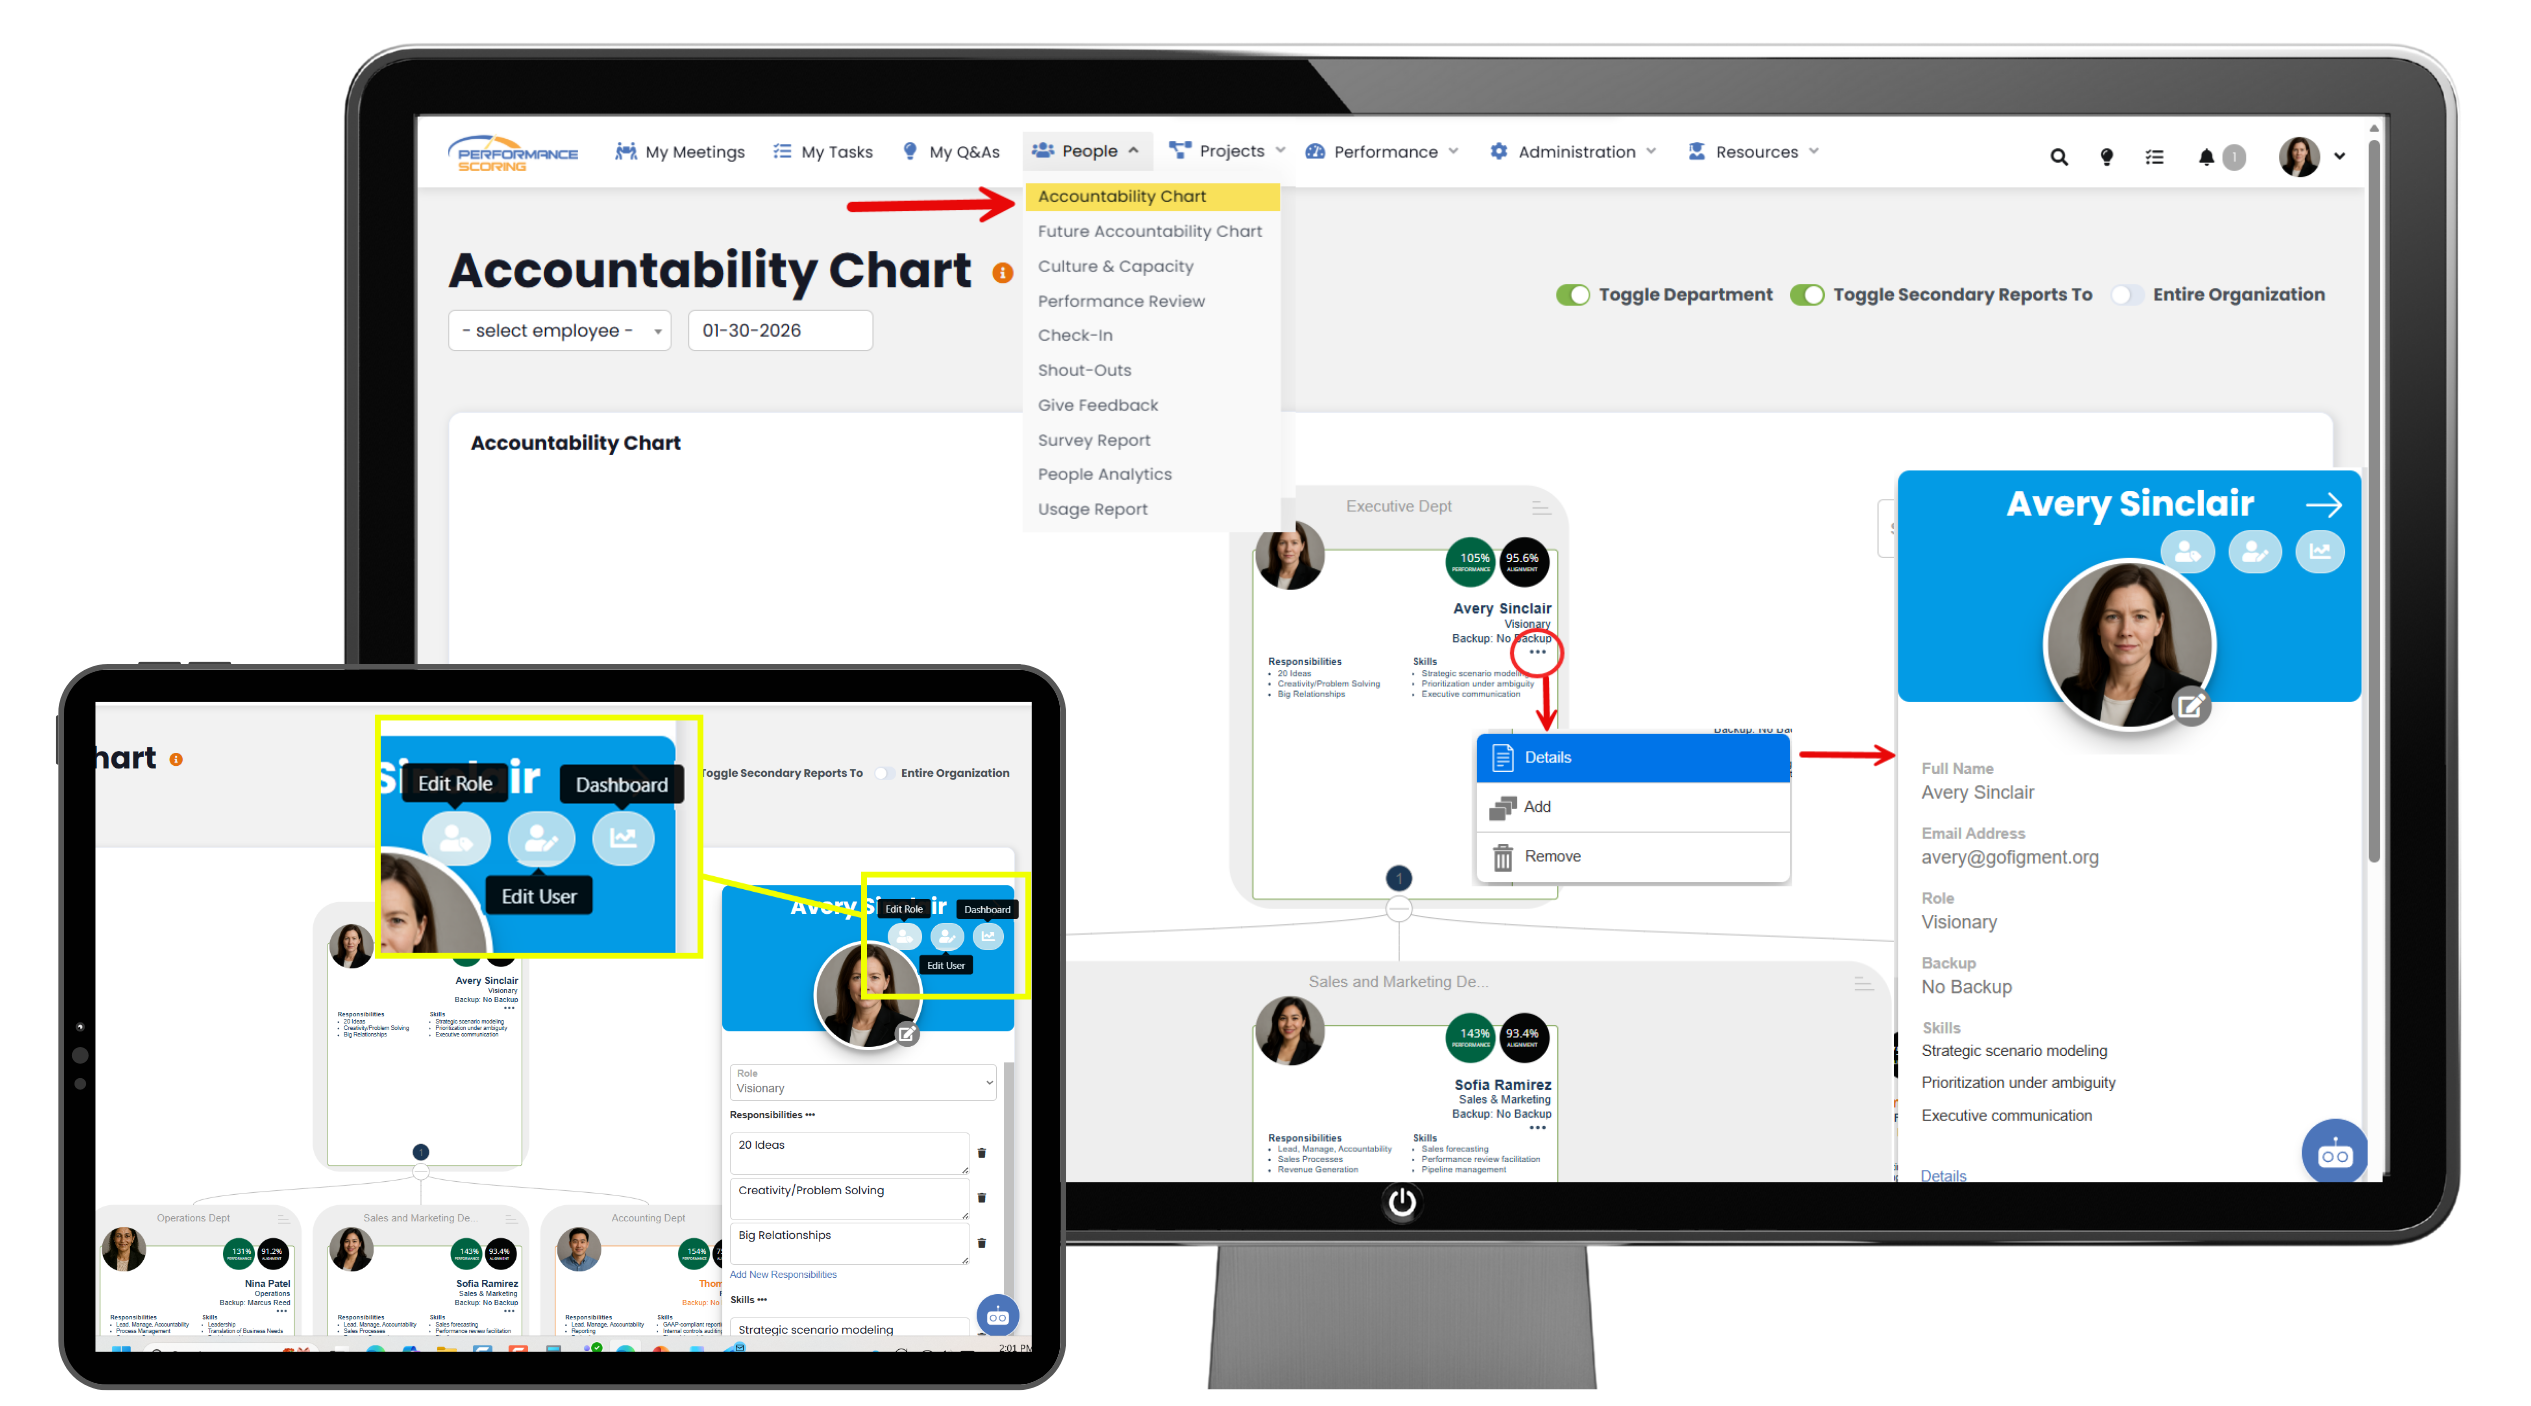
To access the Accountability Chart from the main navigation panel, click People, then select the Accountability Chart.
Within a user’s tile, click the three dots to open a dropdown menu. Selecting Details will open a slide-out displaying the user’s information. If your permissions allow editing, you can update the user’s details, adjust their role, and view their Individual Dashboard.
From the dropdown menu, you can also add a user or remove the current user tile. When a new user is added, a tile is automatically created on the Accountability Chart. To delete that tile, click the three dots on the newly created tile and select the remove option.
Tile Information
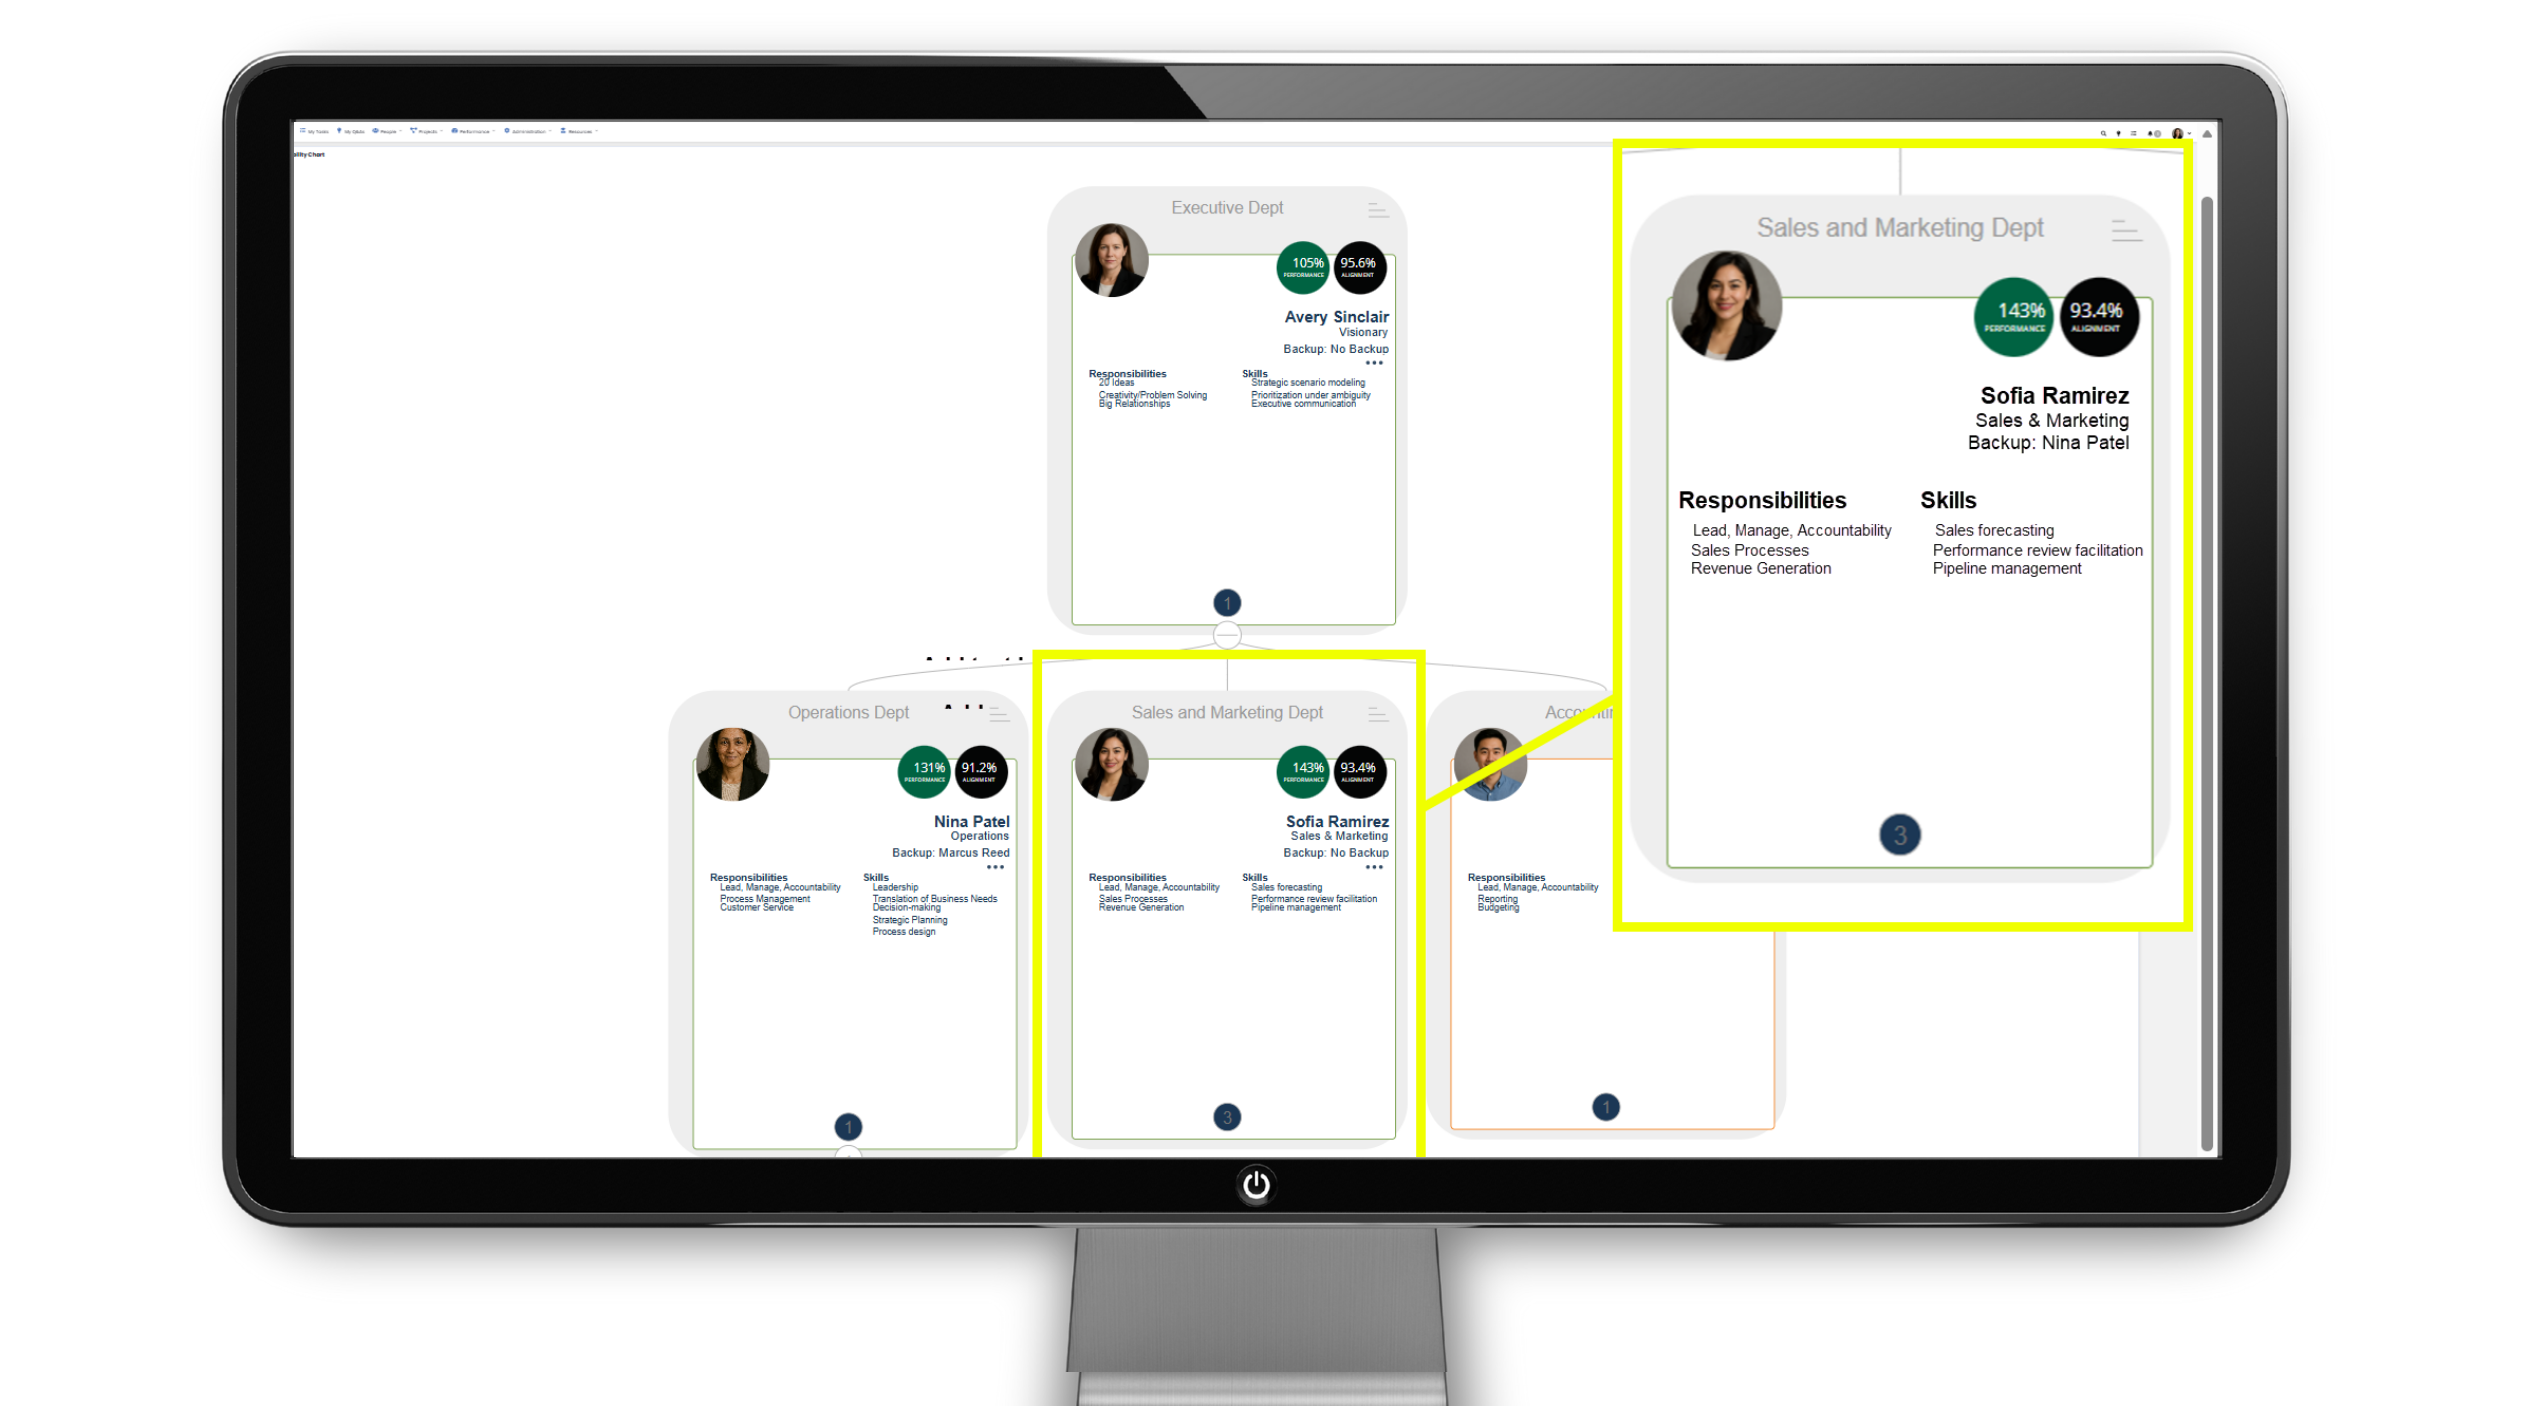
On the Accountability Chart, each user tile displays key information at a glance, including the user’s name, role or seat, and primary responsibilities. The tile provides quick visibility into who owns what within the organization and how roles are structured. This makes it easy to understand accountability and reporting relationships across the team.
- Performance Percentage – shows how consistently a user is completing their assigned tasks and commitments, reflecting execution and follow-through.
- Alignment Percentage – indicates how well a user’s work aligns with company priorities, goals, and metrics, ensuring efforts are focused on what matters most.
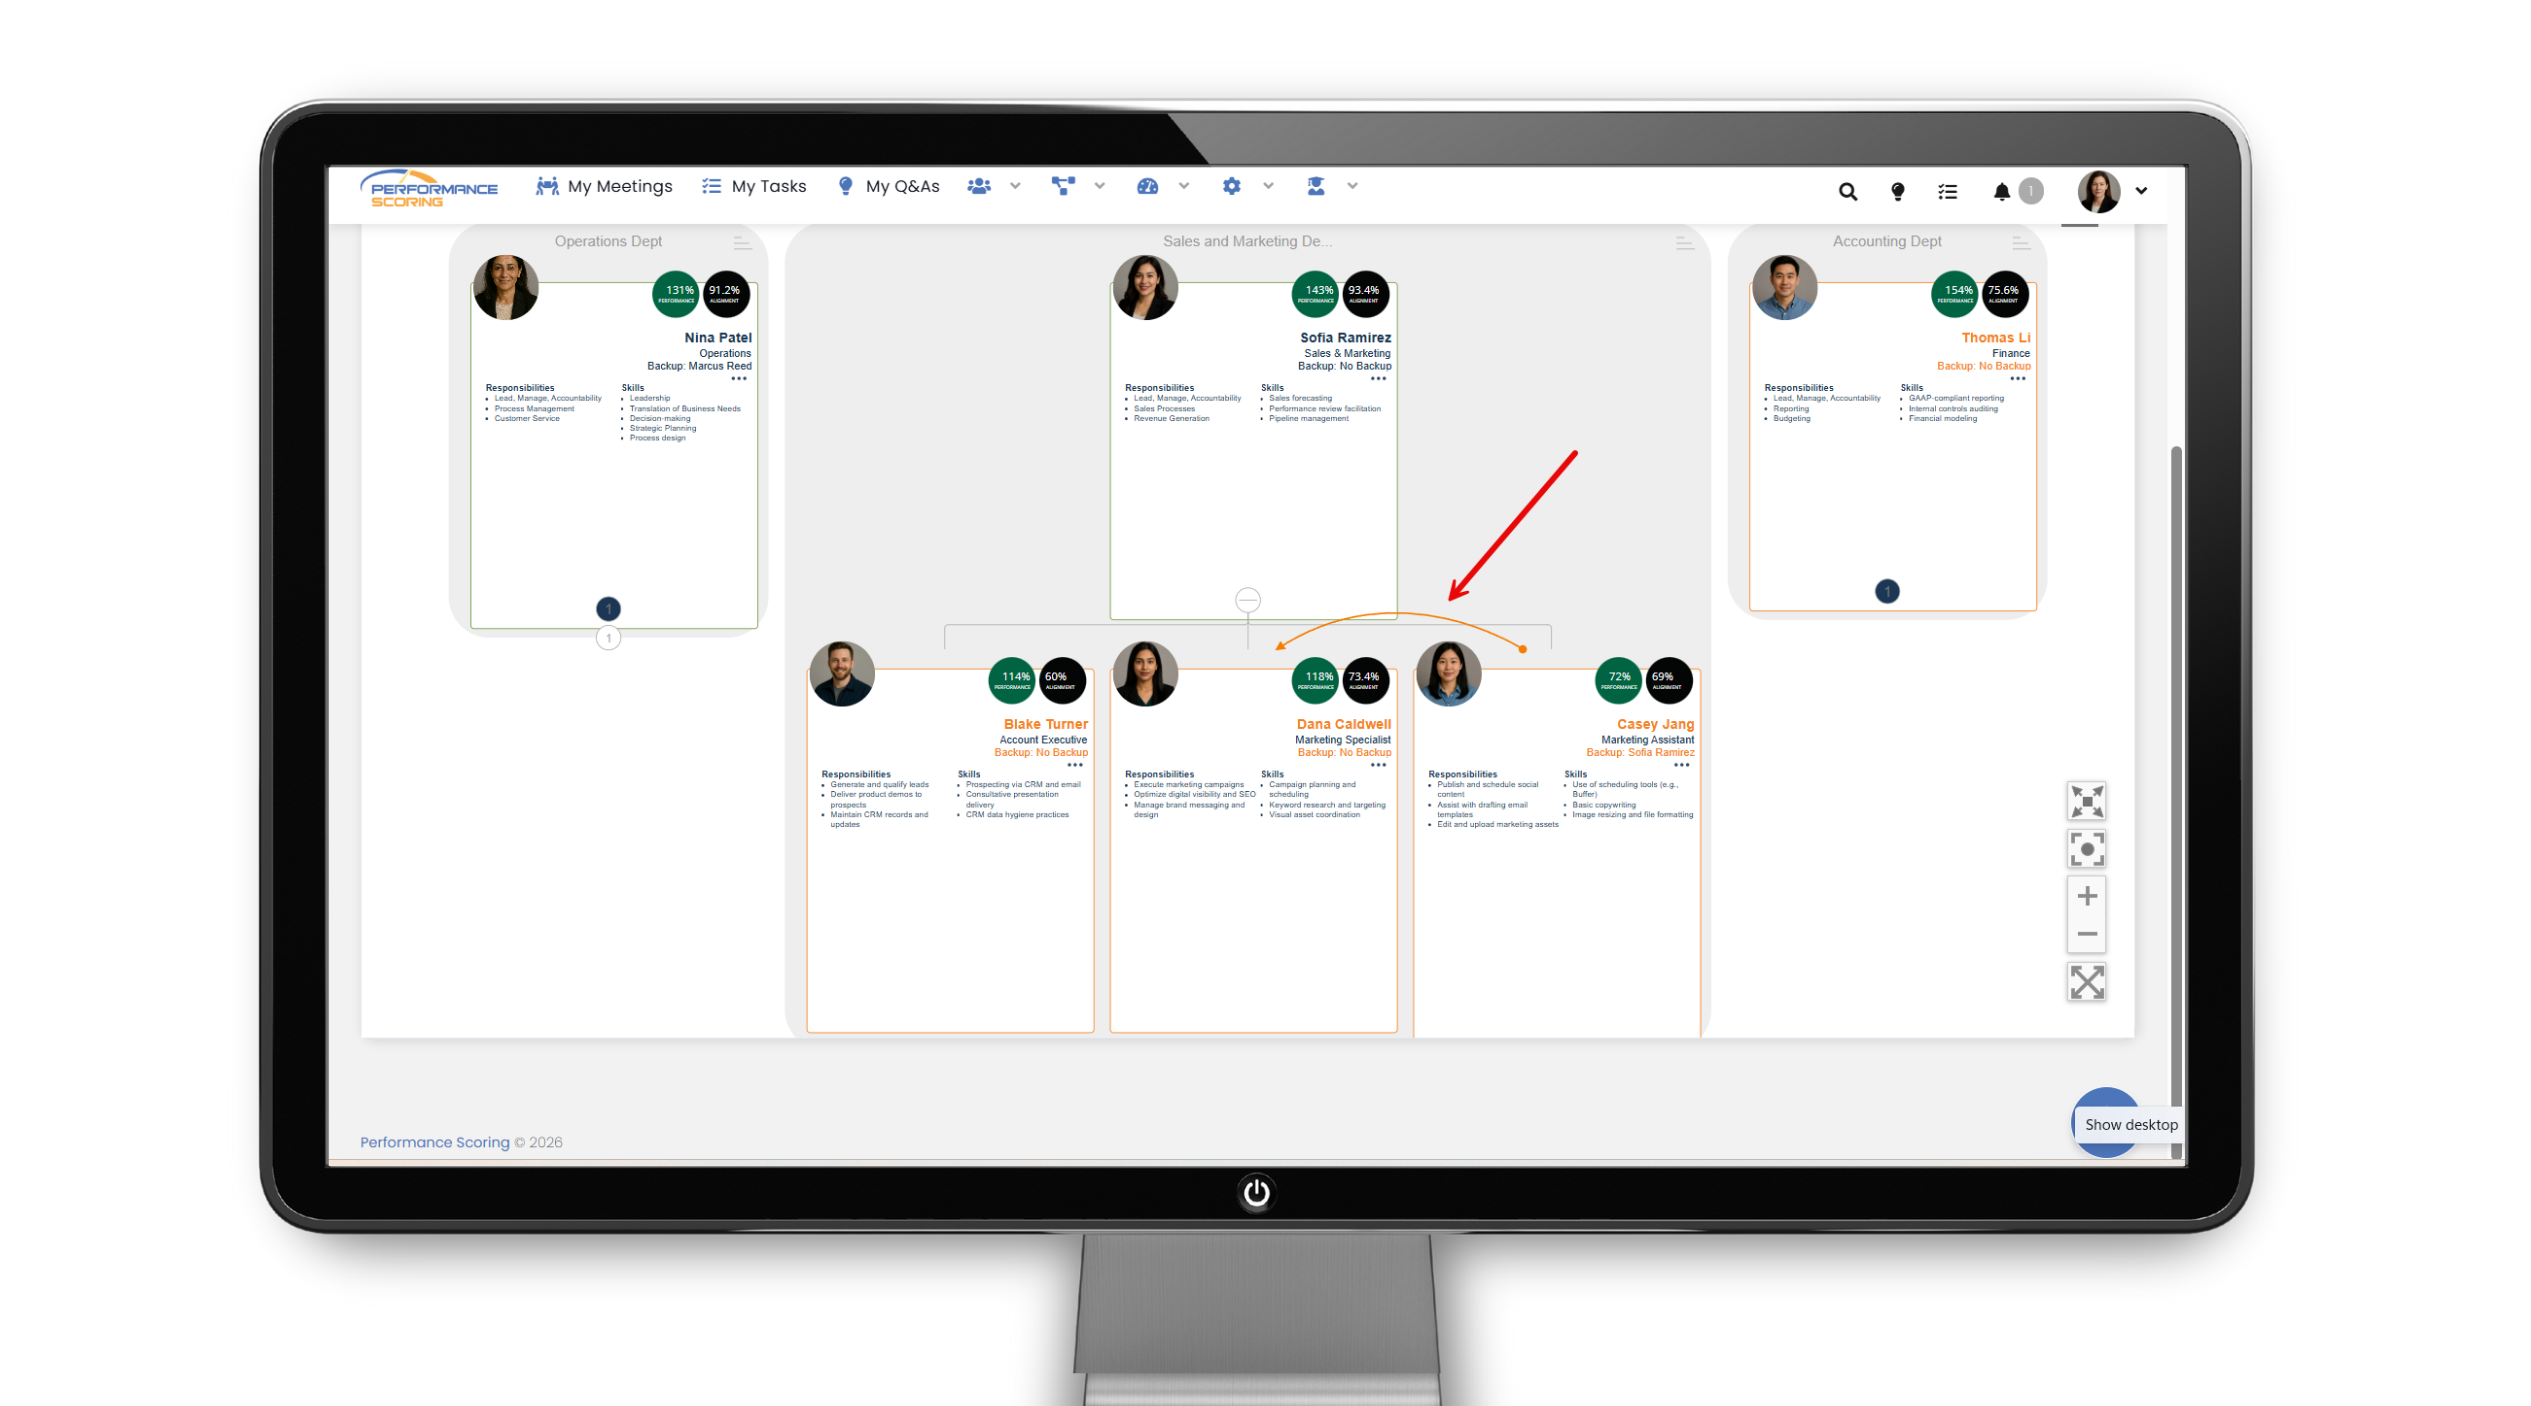
Moving Tiles
On the Accountability Chart, you can reorganize roles by simply dragging and dropping user tiles. Click and hold a tile, then drag it to the appropriate position to update reporting relationships or role structure. Changes are saved automatically, making it easy to keep the chart accurate as your organization evolves.
Quick Tips:
- Focus on roles, not people when organizing the chart to maintain clarity as teams change.
- Use drag and drop regularly to keep reporting relationships up to date.
- Review the chart quarterly to ensure accountability still matches current responsibilities.
➜ See full Knowledge Base training article here.
>Up Next: Business Plan Overview in Performance Scoring
Further Reading
- Harvard Business Review — Define accountability clearly
https://hbr.org/2016/06/to-hold-someone-accountable-first-define-what-accountable-means - Harvard Business Review (PDF) — “Who Has the D?” decision-rights model
https://ceo.usc.edu/wp-content/uploads/2018/03/5-Who-has-the-D_HBR.pdf - Harvard Business School Online — Ethics & accountability at work
https://online.hbs.edu/blog/post/ethics-and-accountability-in-the-workplace - McKinsey — The limits of RACI (and better decision clarity)
https://www.mckinsey.com/capabilities/people-and-organizational-performance/our-insights/the-organization-blog/the-limits-of-raci-and-a-better-way-to-make-decisions - MIT Sloan — Redesigning work (roles & responsibilities)
https://mitsloan.mit.edu/ideas-made-to-matter/how-to-redesign-work-age-ai